

Every risk on real terrain. Before the storm lands.
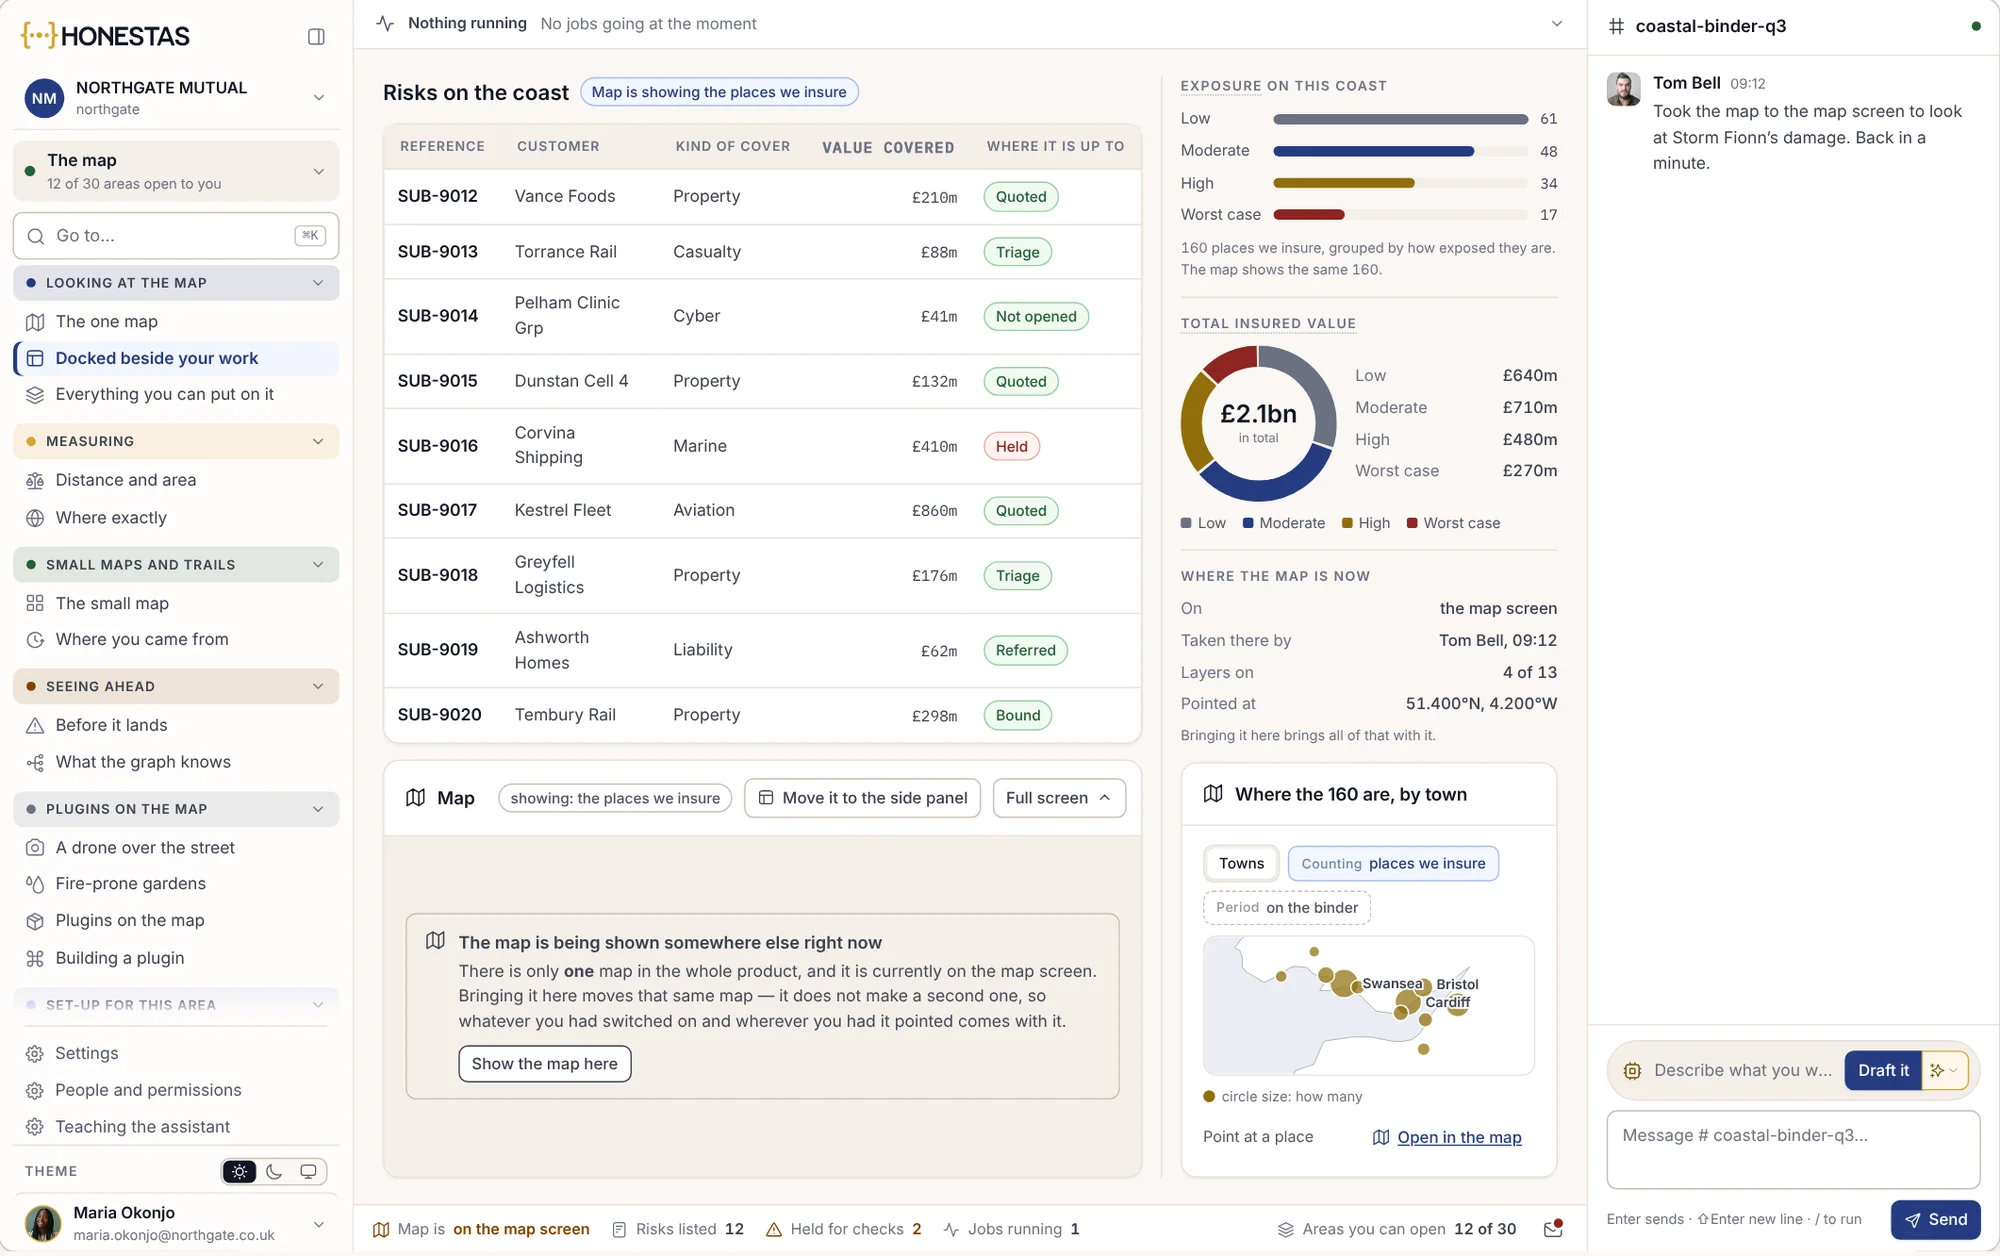
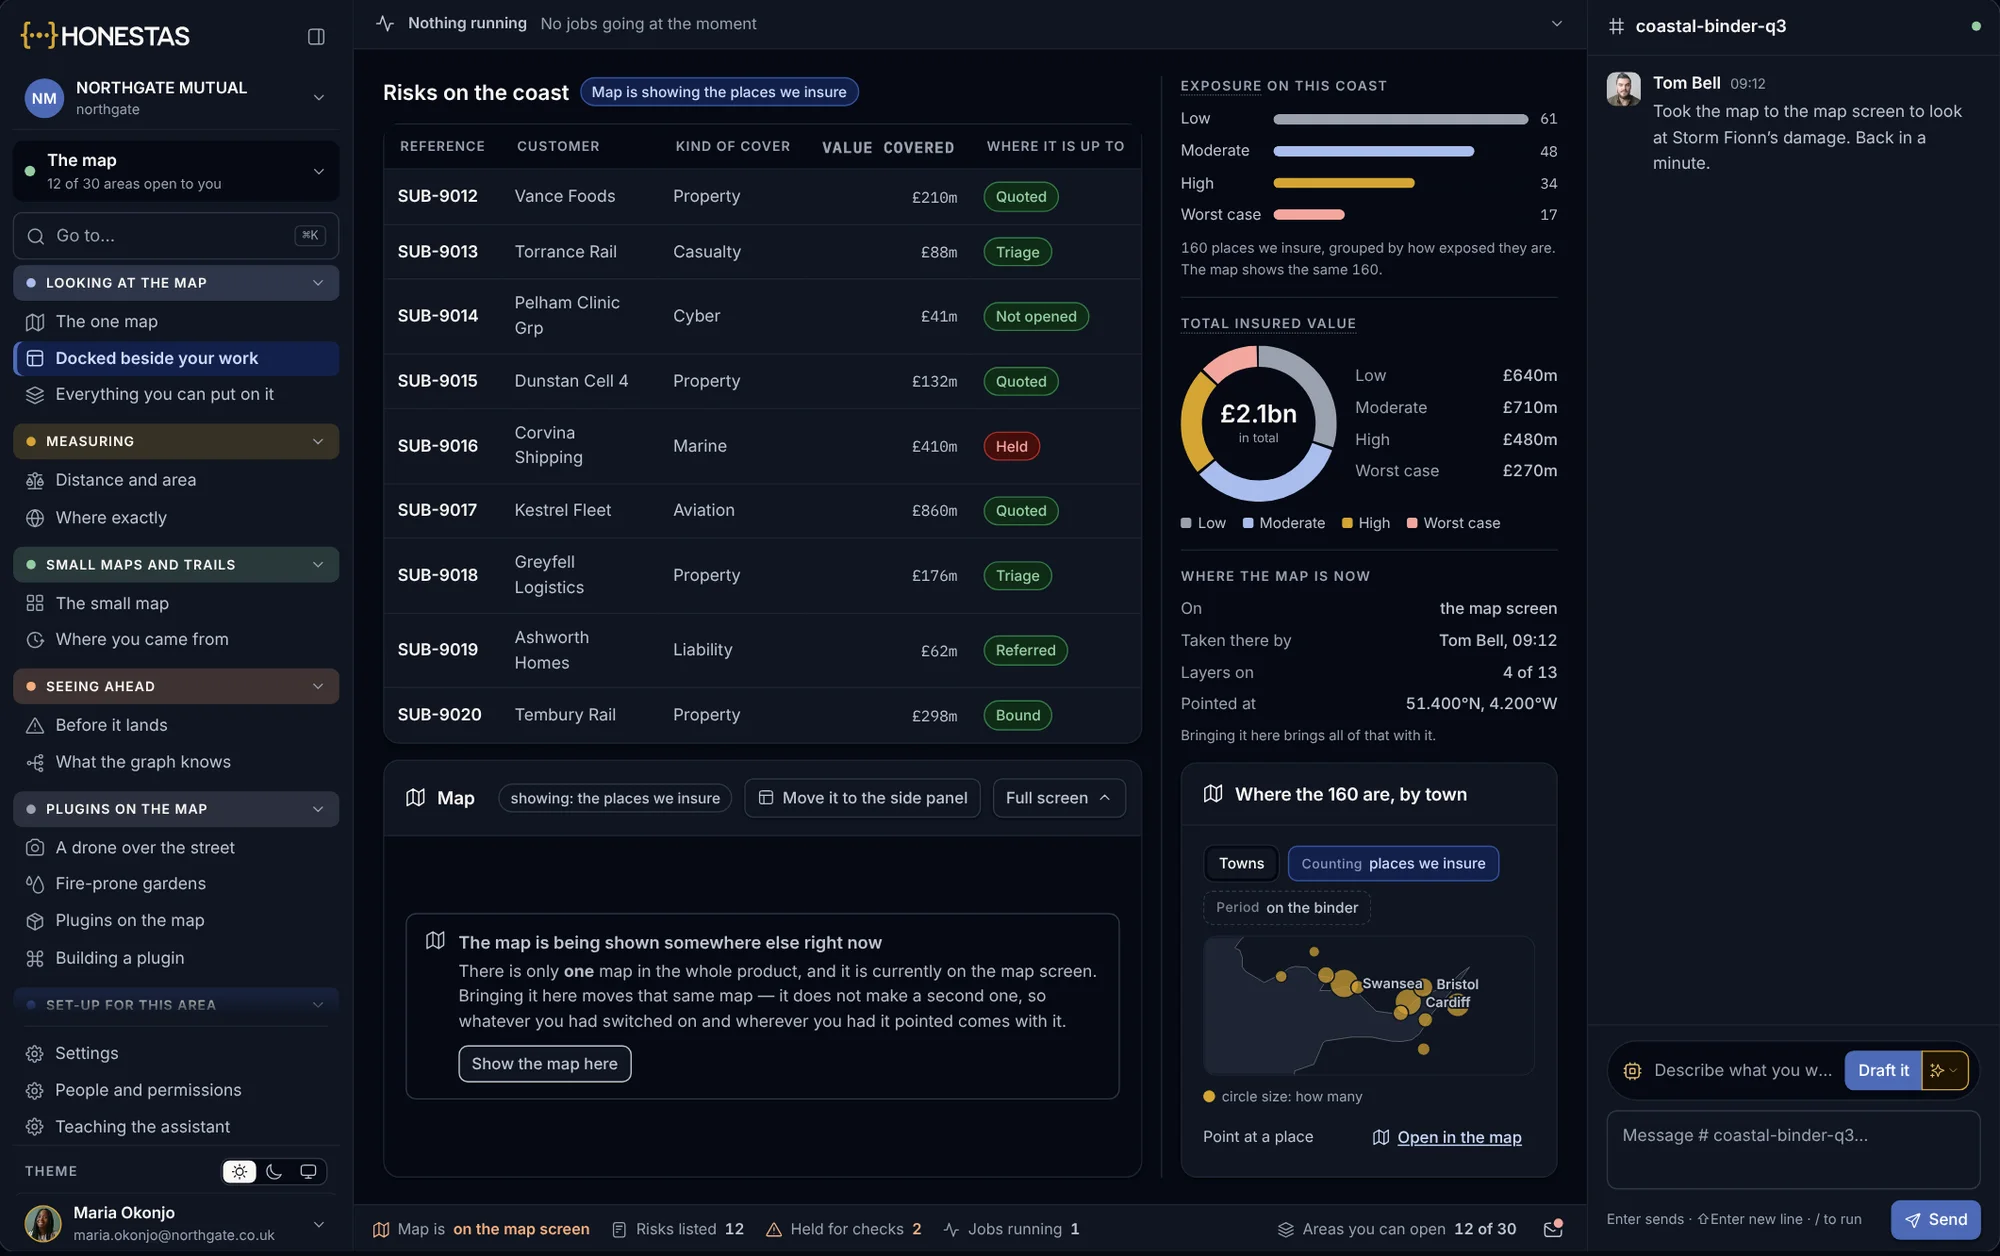
Every insured property sits on a 3D map, with live hazard feeds from Copernicus, NOAA, USGS and FIRMS. Draw the storm’s path, see the exposure inside it and open the claims that are coming, before the first call. Exposure comes in on the industry’s own format, and the map works in the field with no signal.
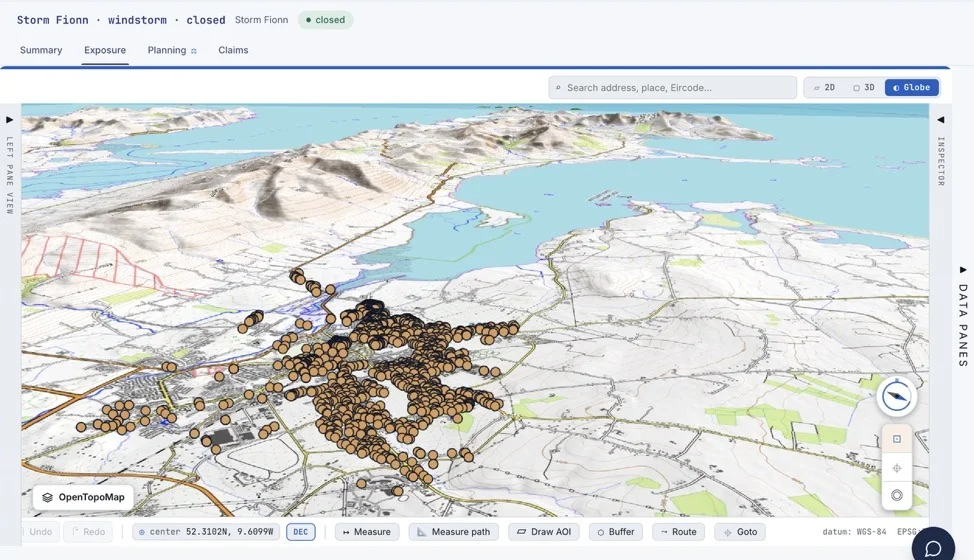
One map, wherever you work.
The same map sits behind the claims list, the conversation and the underwriting desk. Each person sees the layers their role allows.
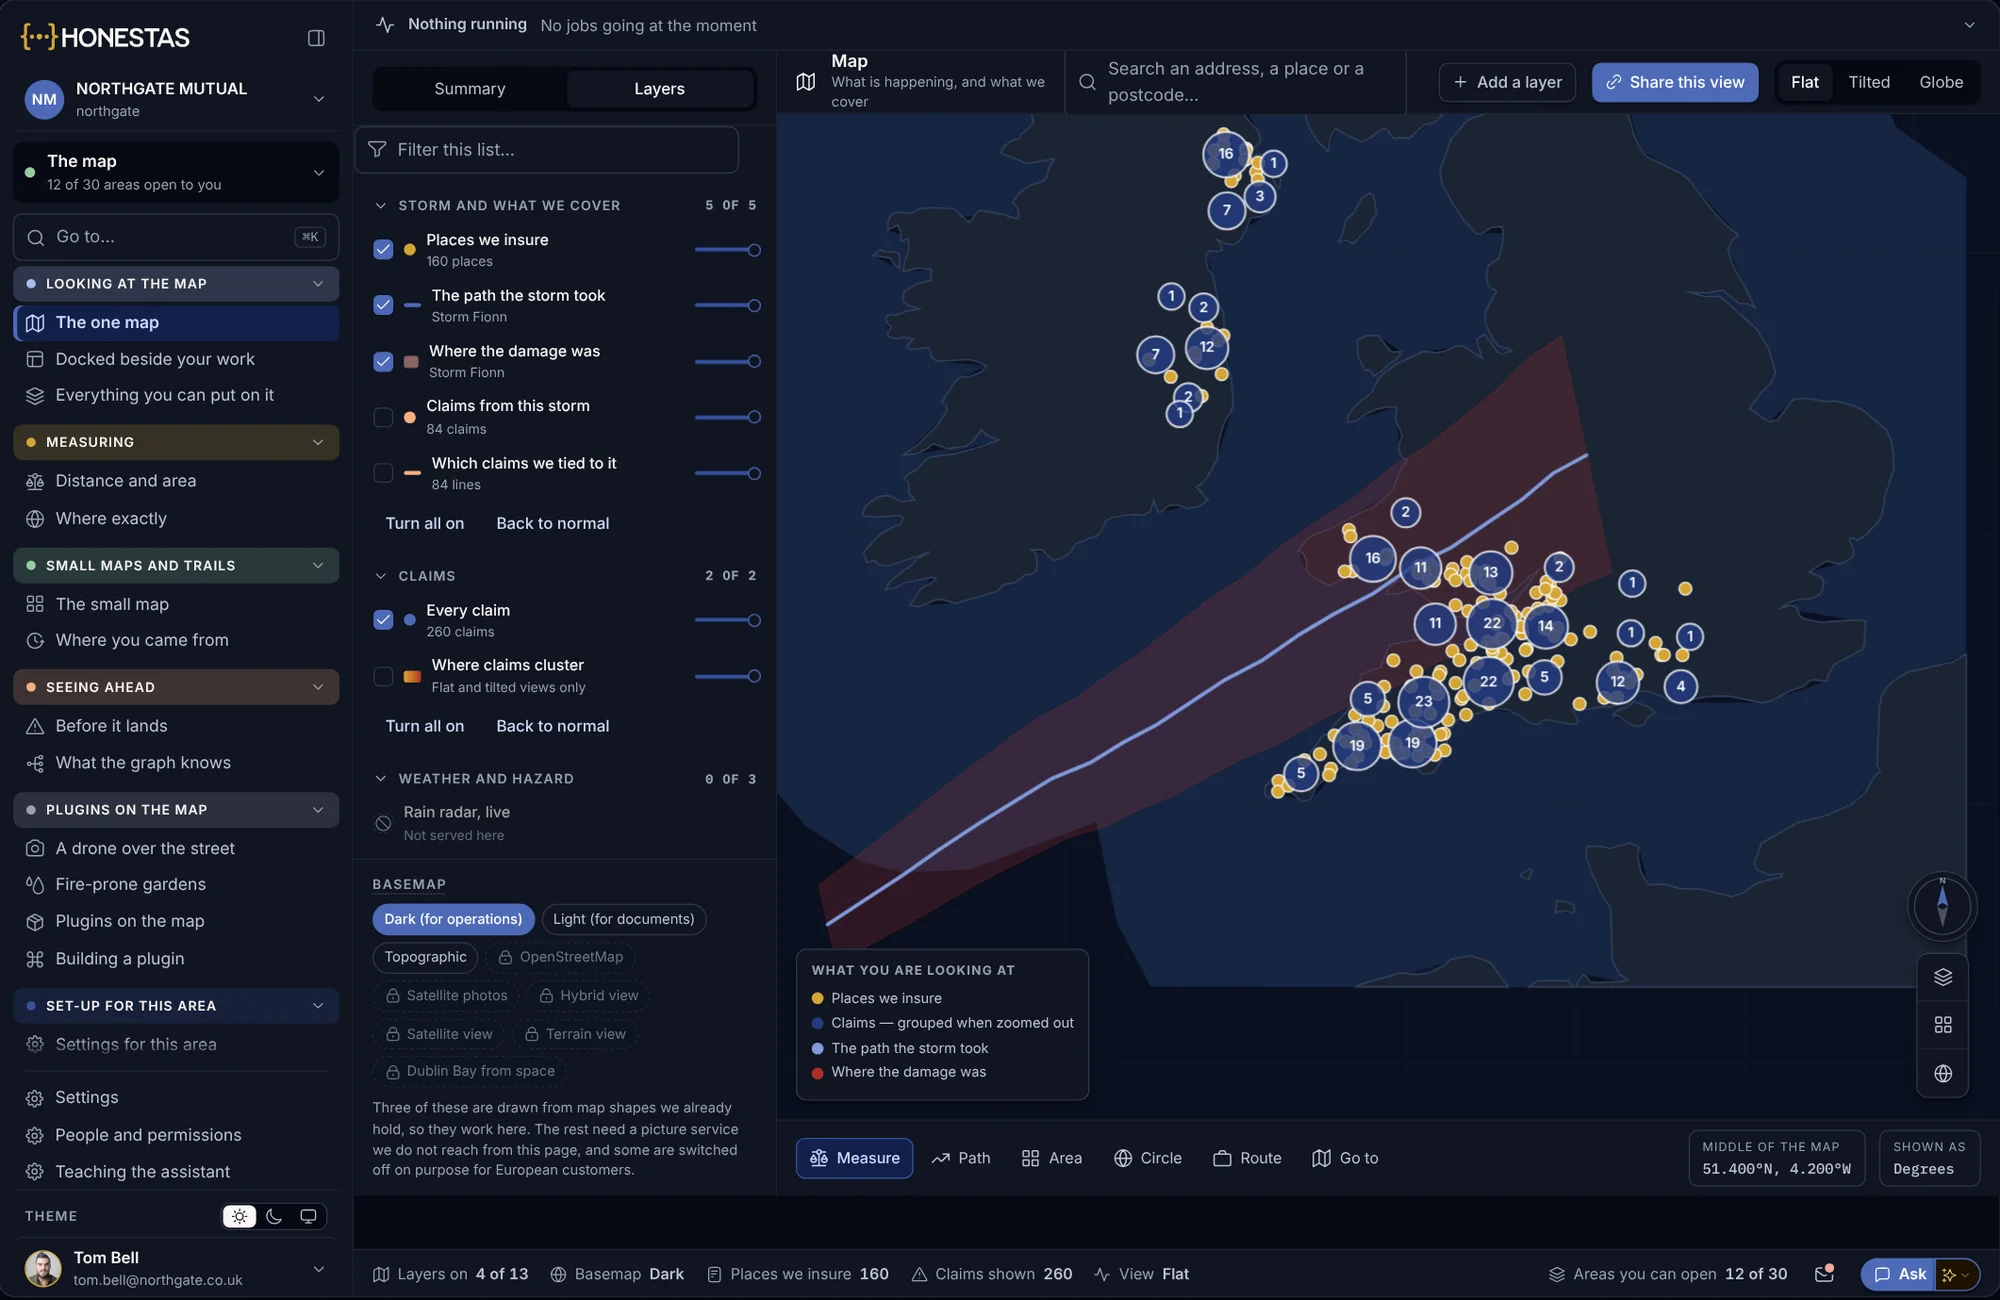
Exposure, the storm and the claims
Places you insure, the path the storm took, where the damage was and the claims from it, on one map you can switch layer by layer.
- Layers by storm, cover and claims
- Grouped when zoomed out

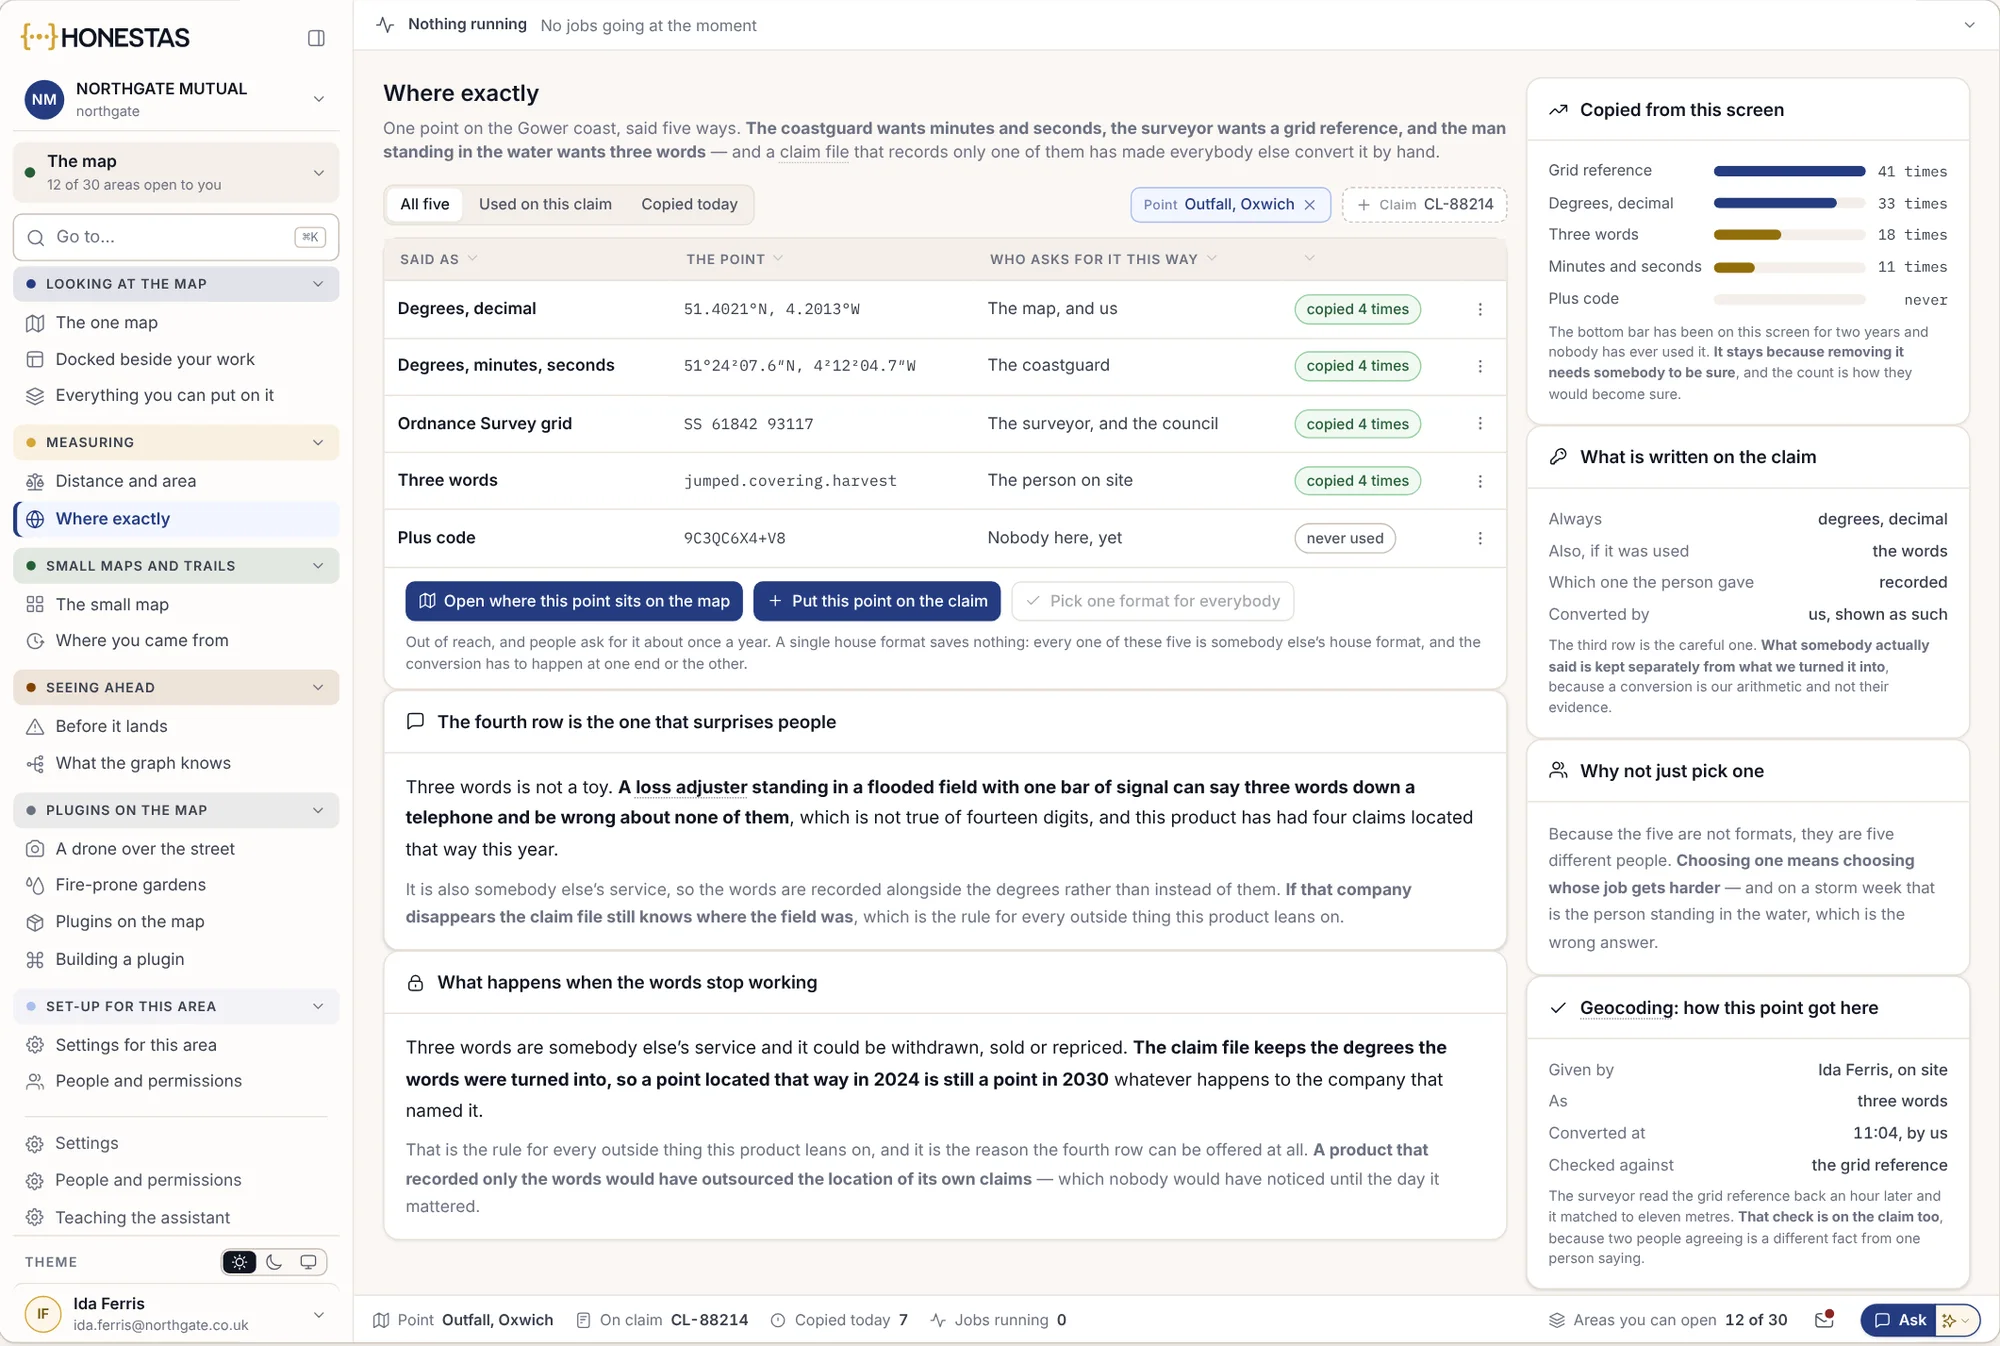
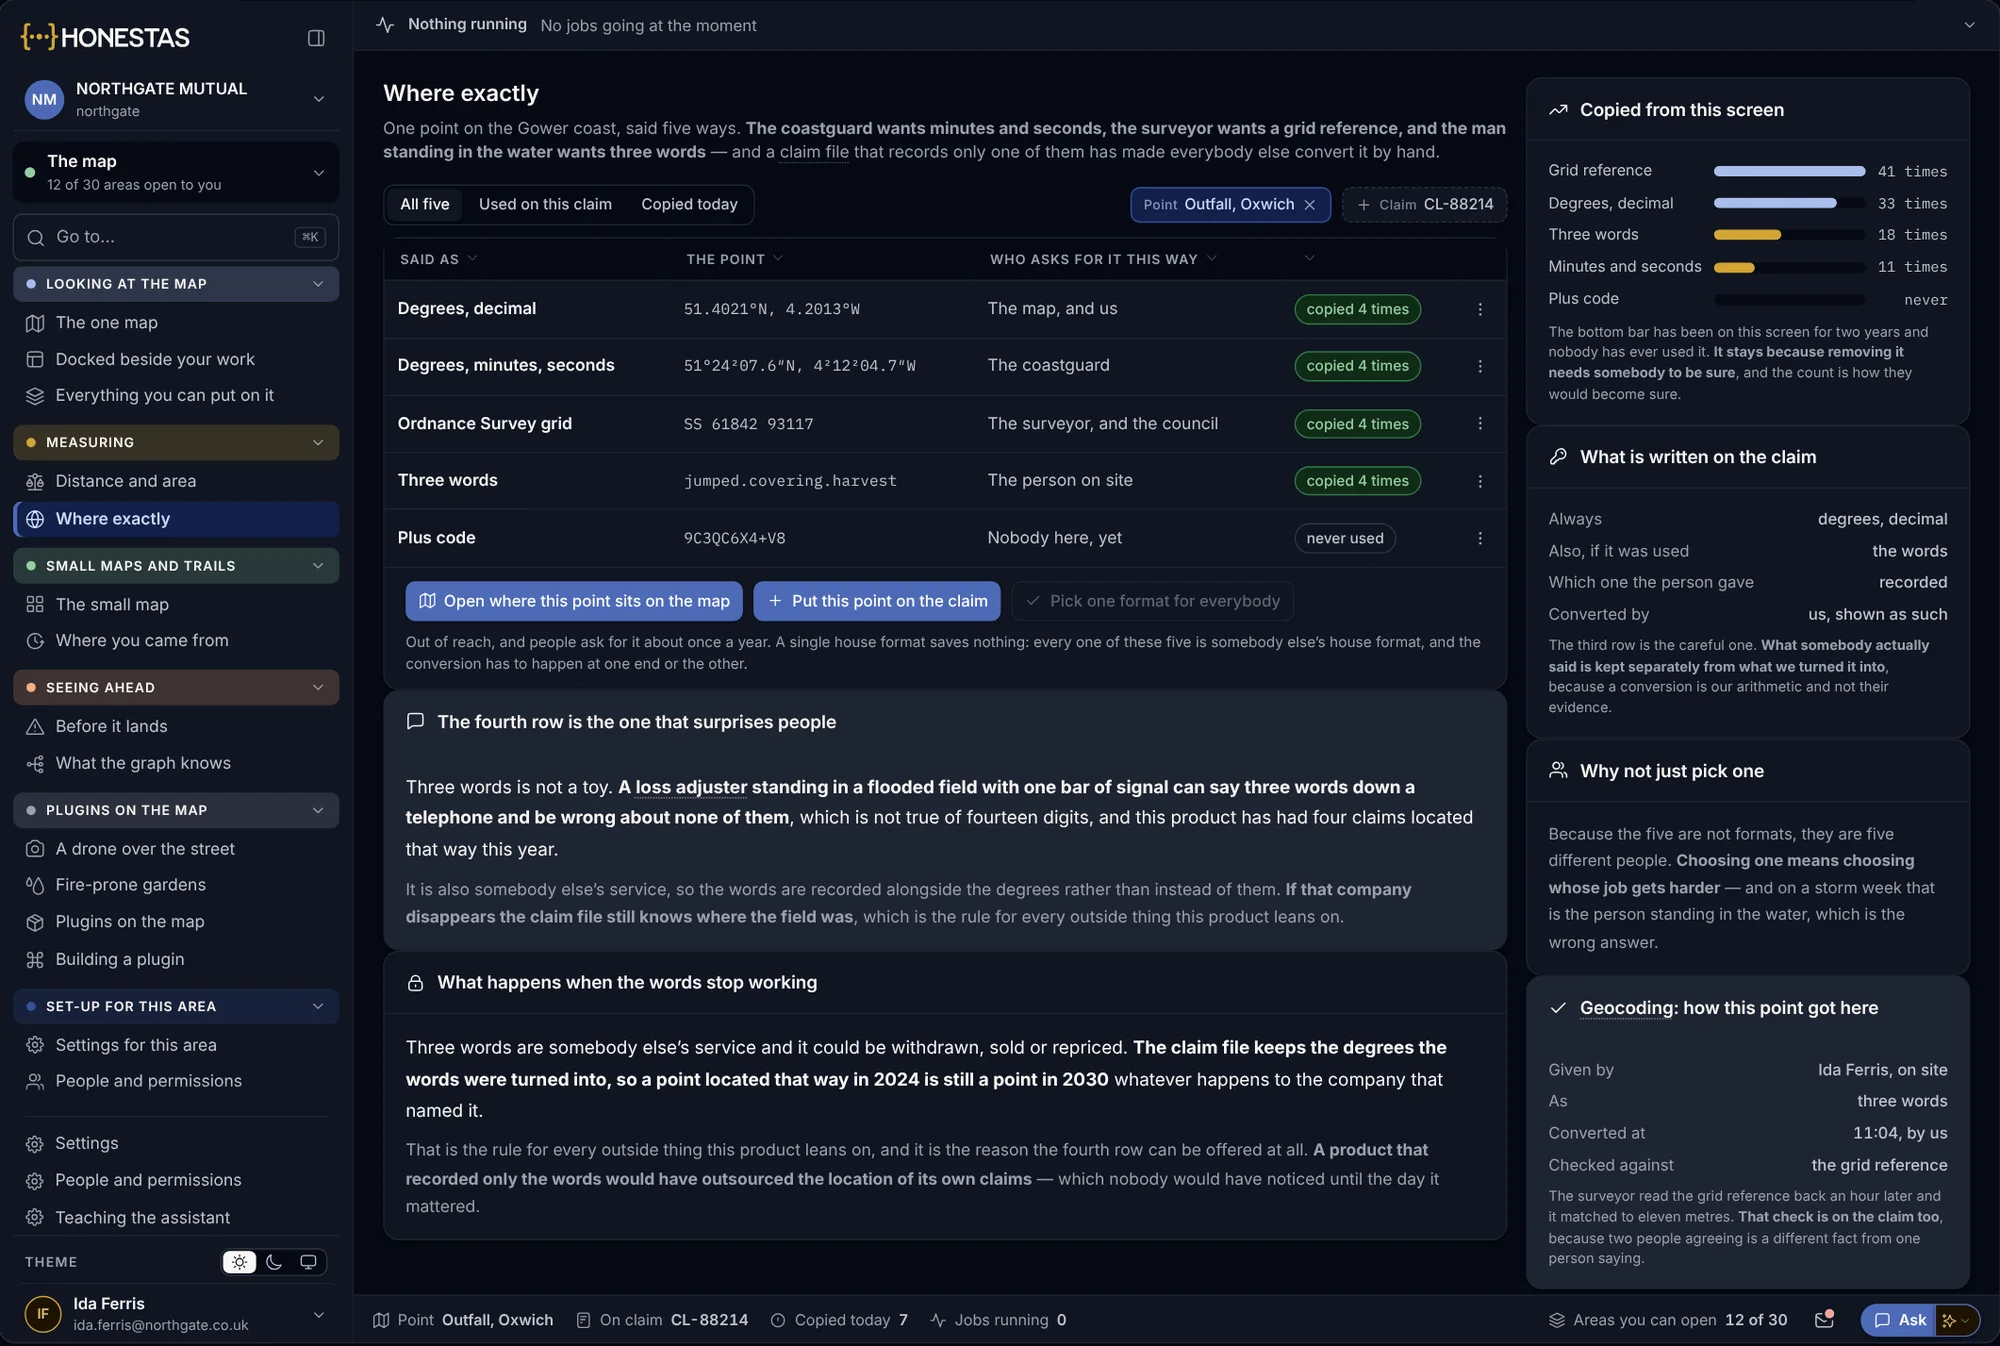
One point, five ways
A loss adjuster on site gives one point in the form each reader needs: coordinates for the map, a grid reference for the surveyor, three words for the phone.
- Every format from one point
- What the person said is kept apart from what was converted
Point at the map from a chat
Draw an area in the conversation and ask what is inside it. Each layer answers for that area only, and a layer you may not see says so.
- Draw, then ask
- Everyone in the thread sees the same shape
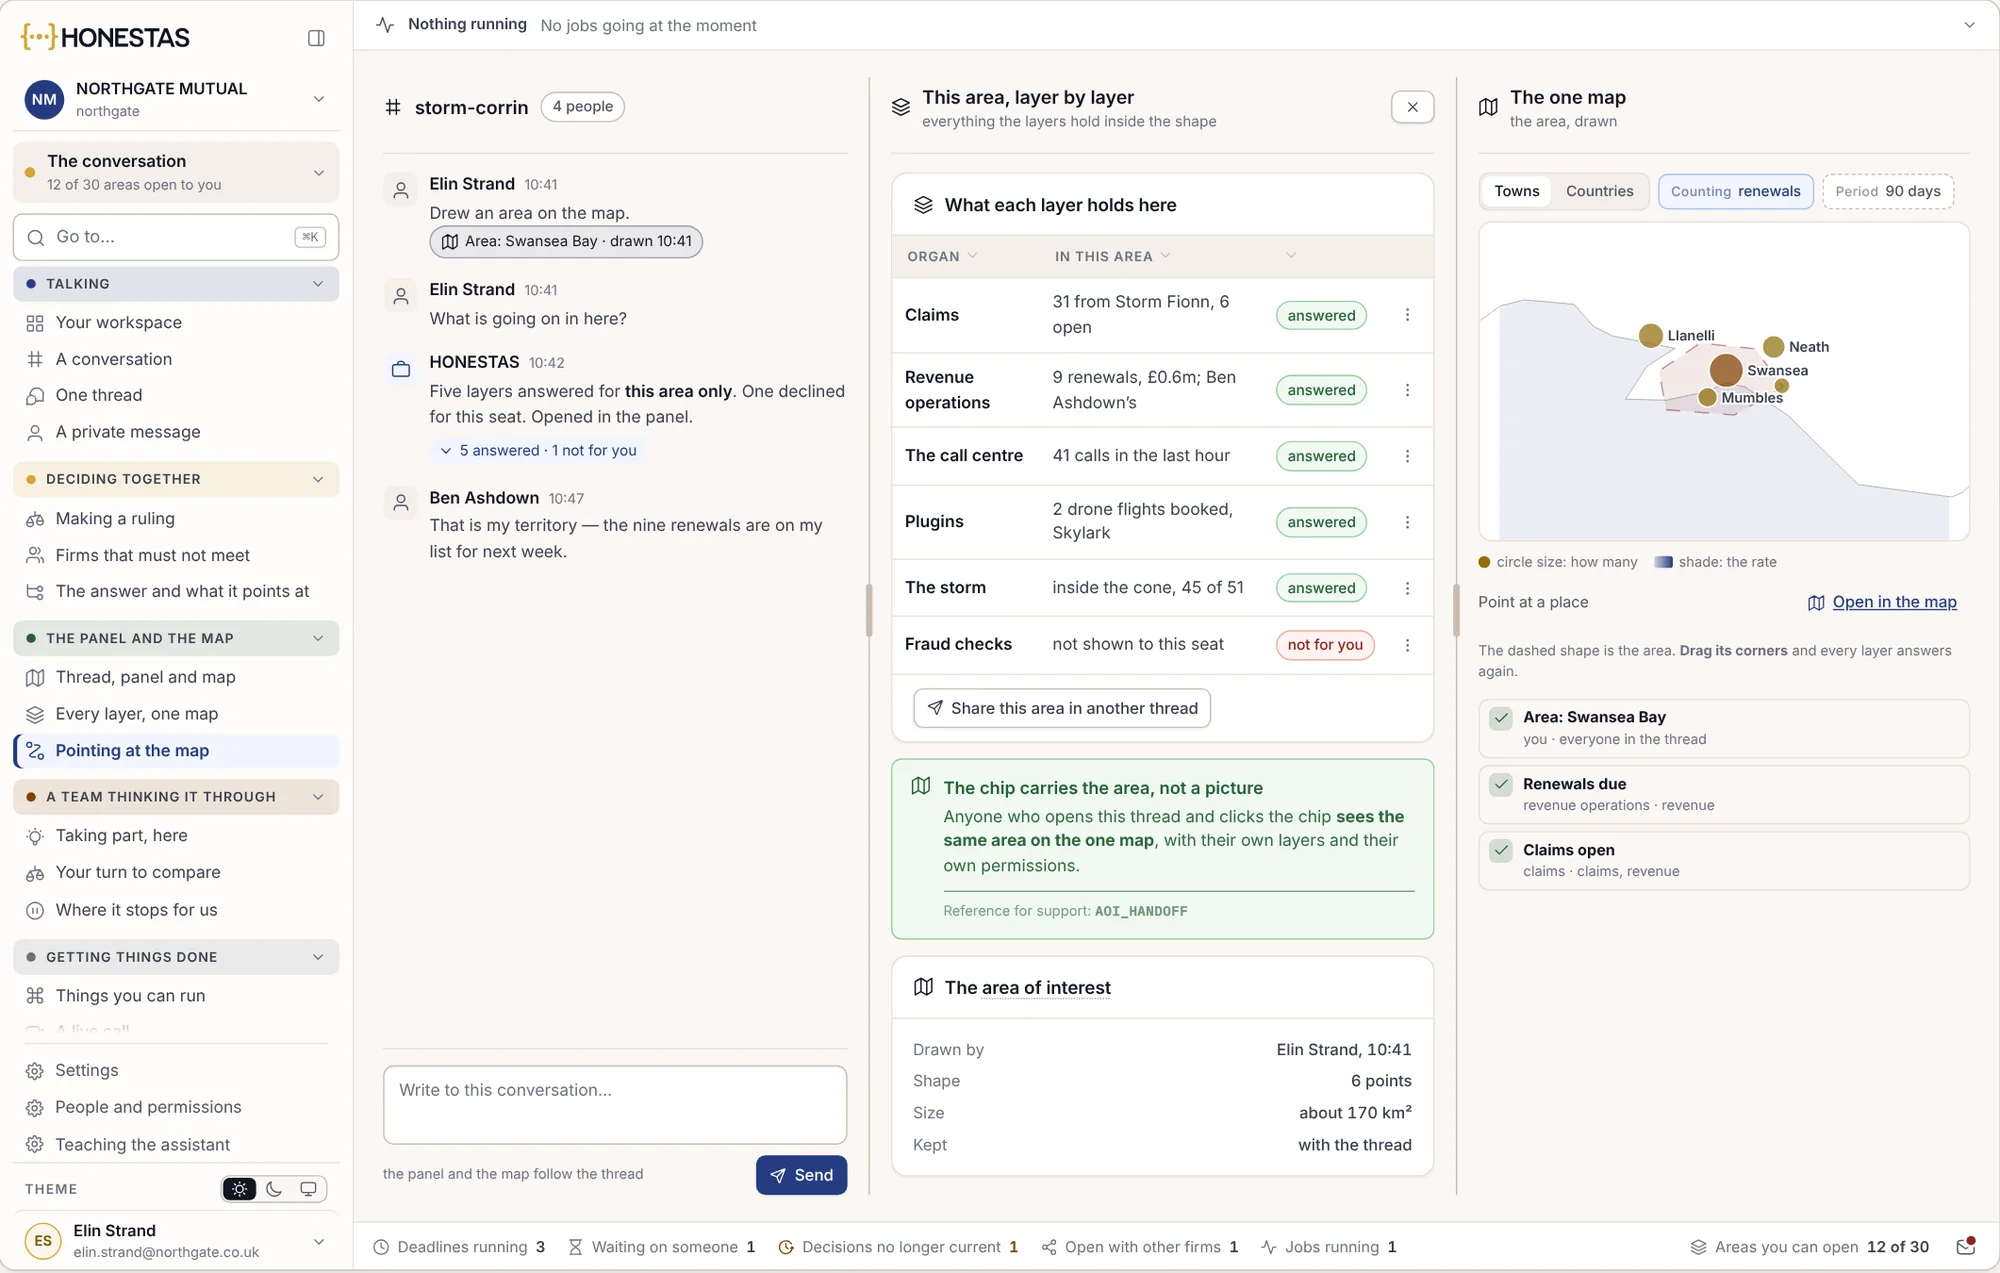
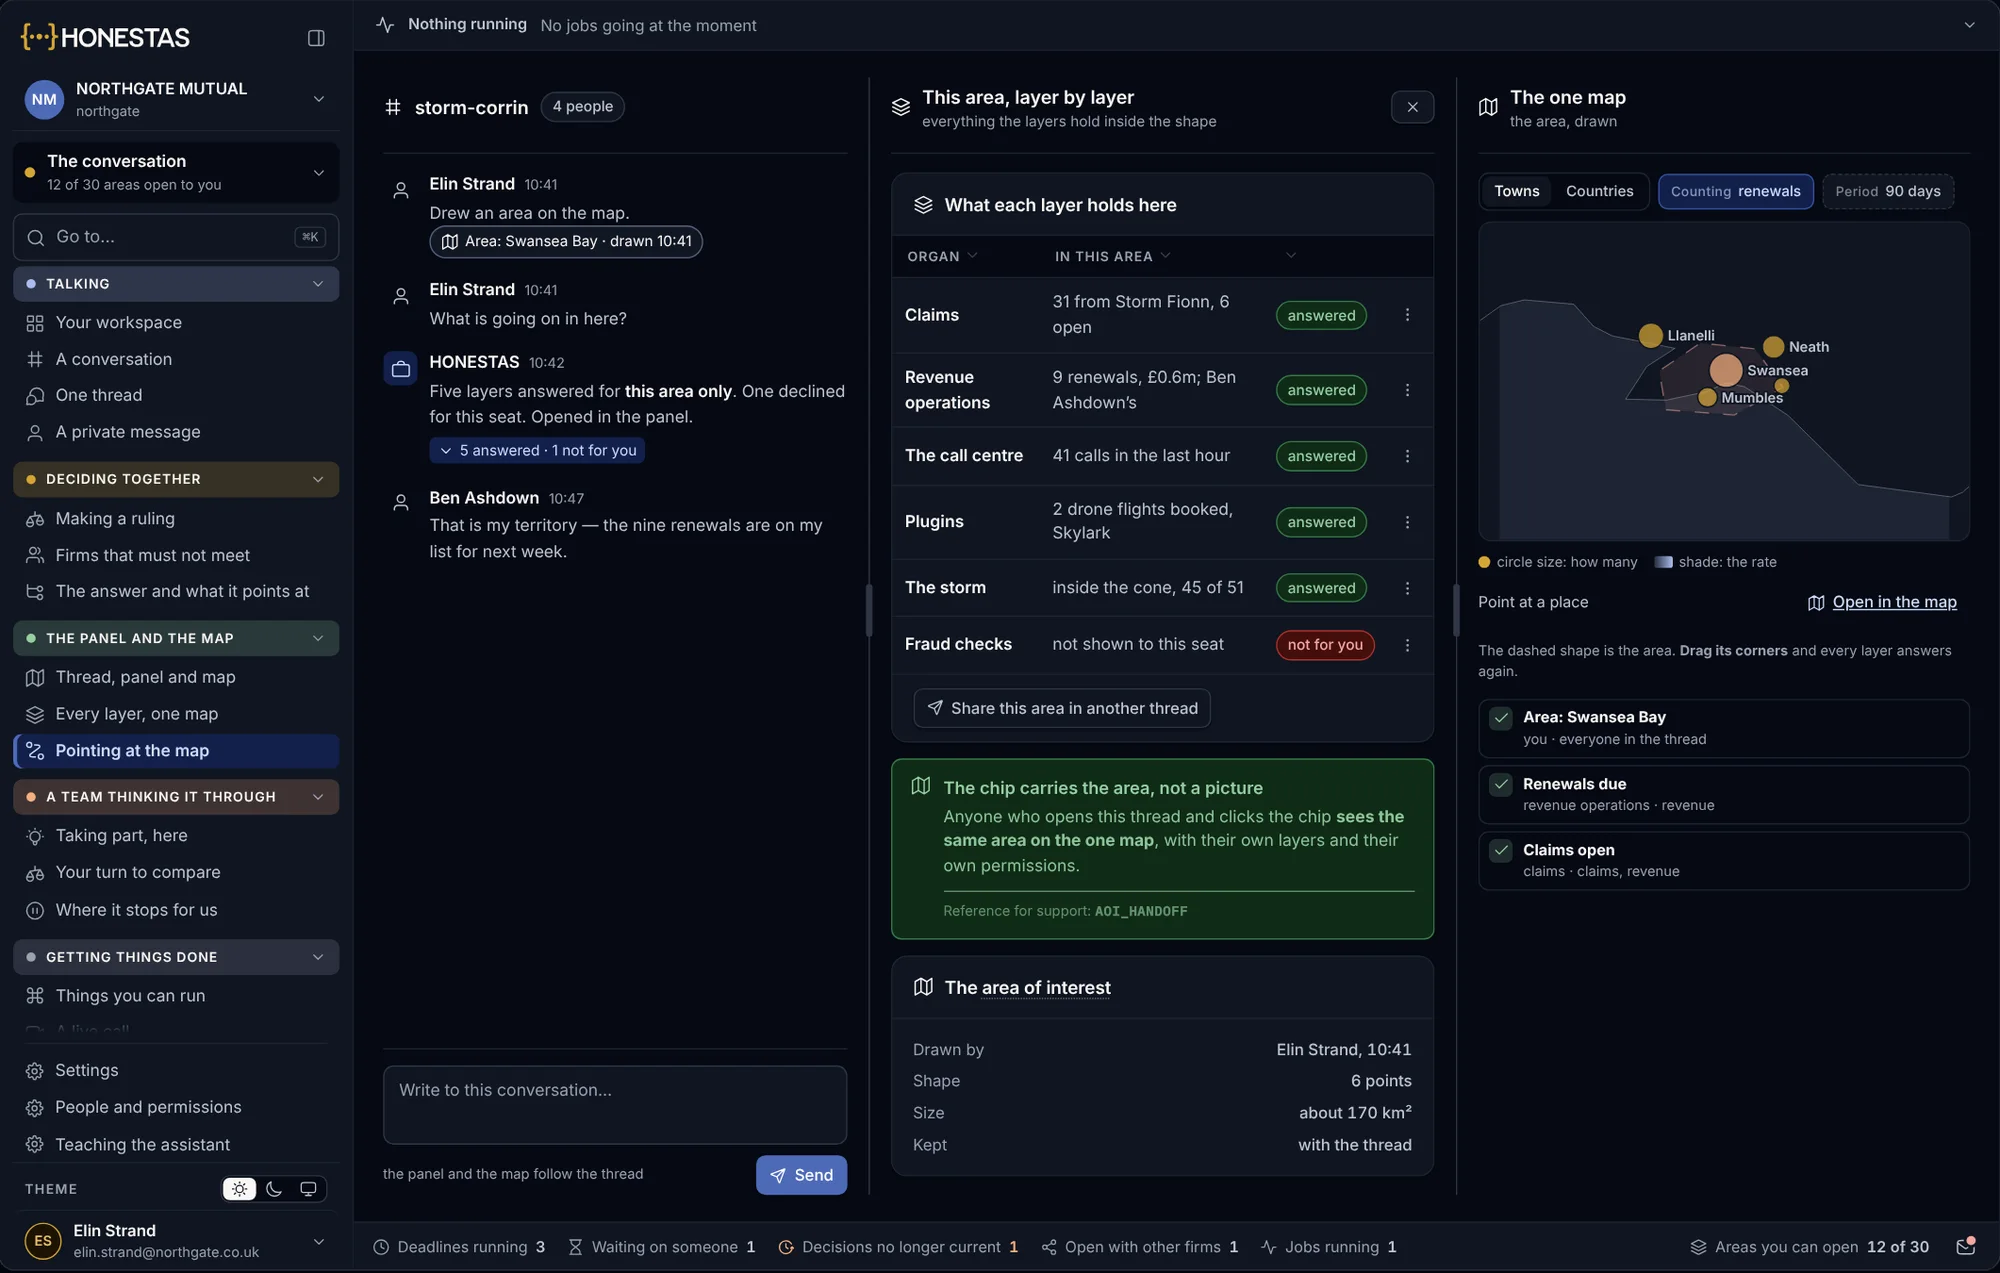
Draw the storm’s path. See who is inside it.
When a storm, flood, wildfire or earthquake is coming, the claims team sees the book it will reach, and starts work before anyone calls.
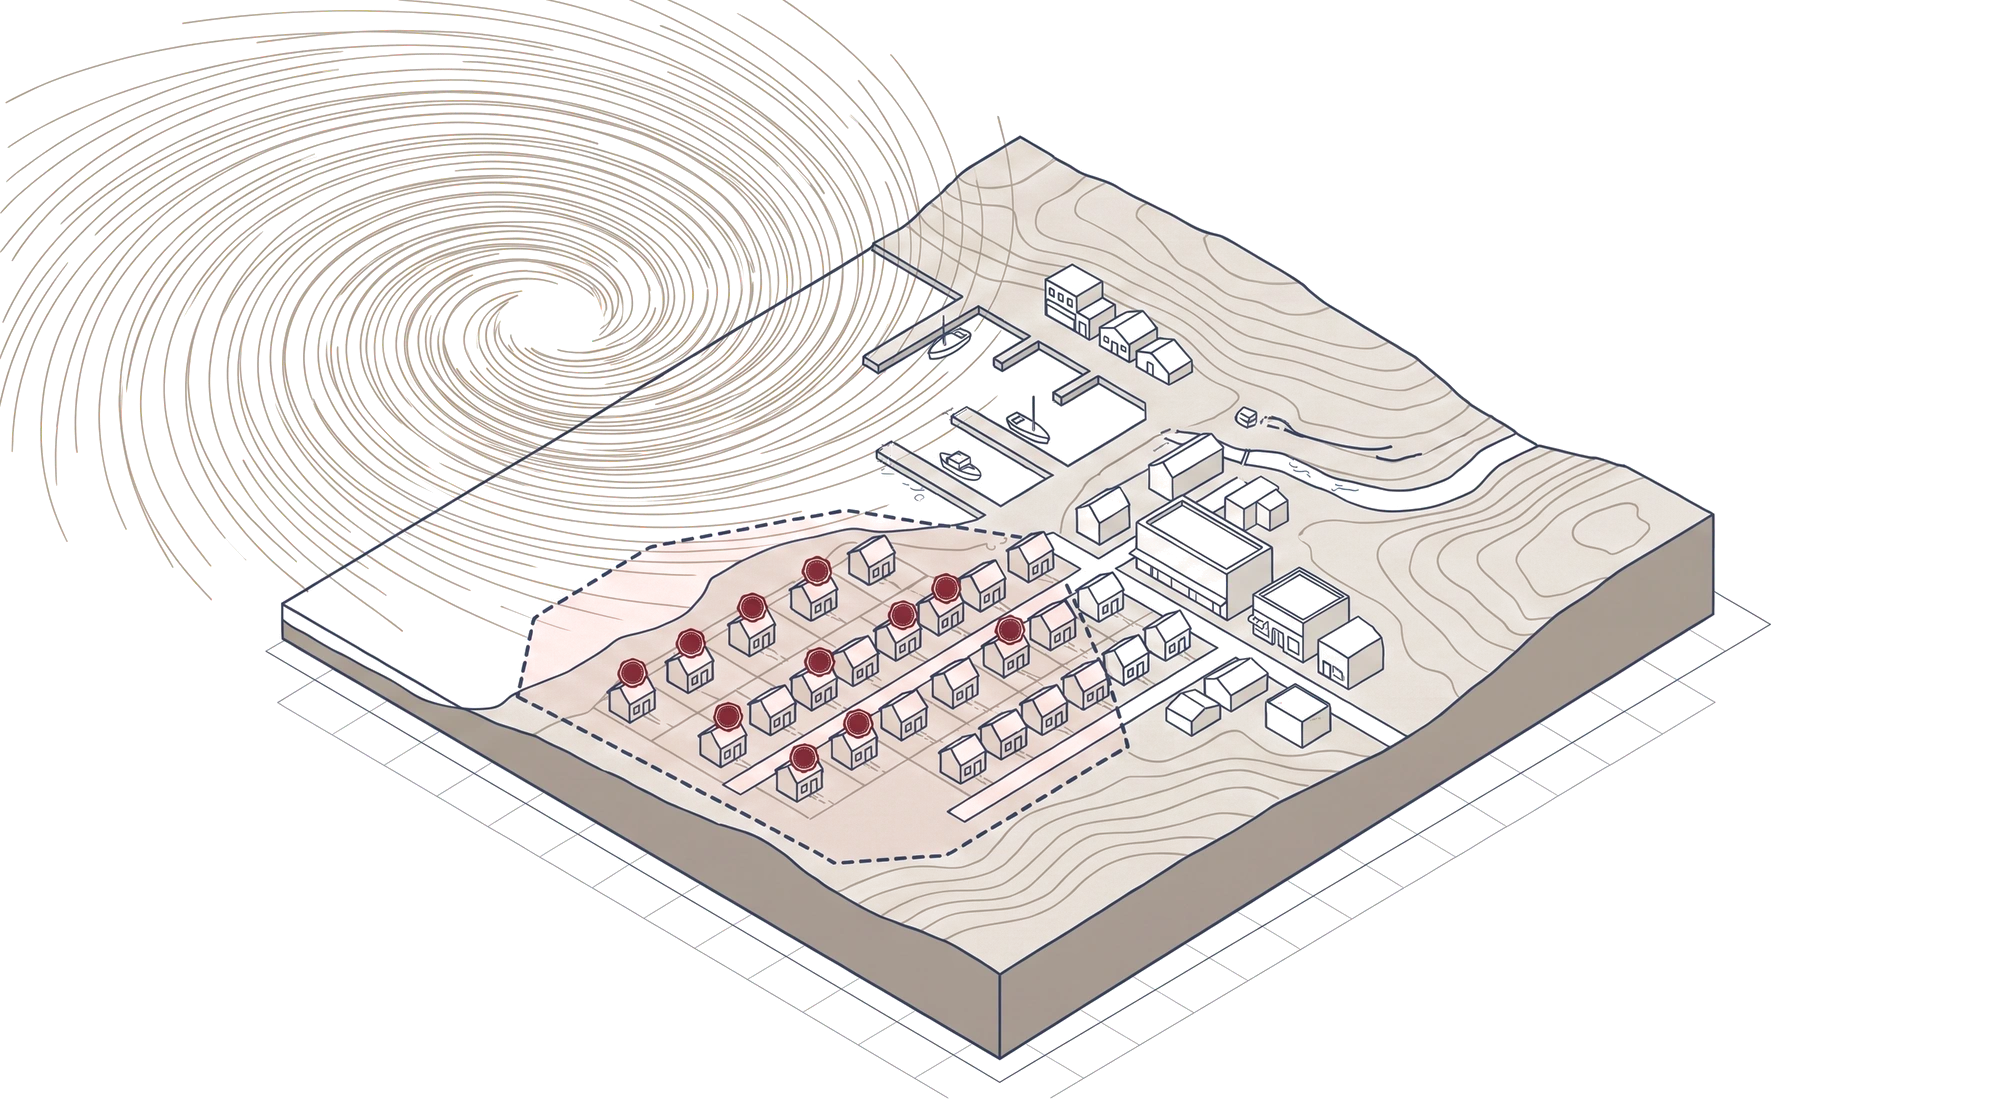
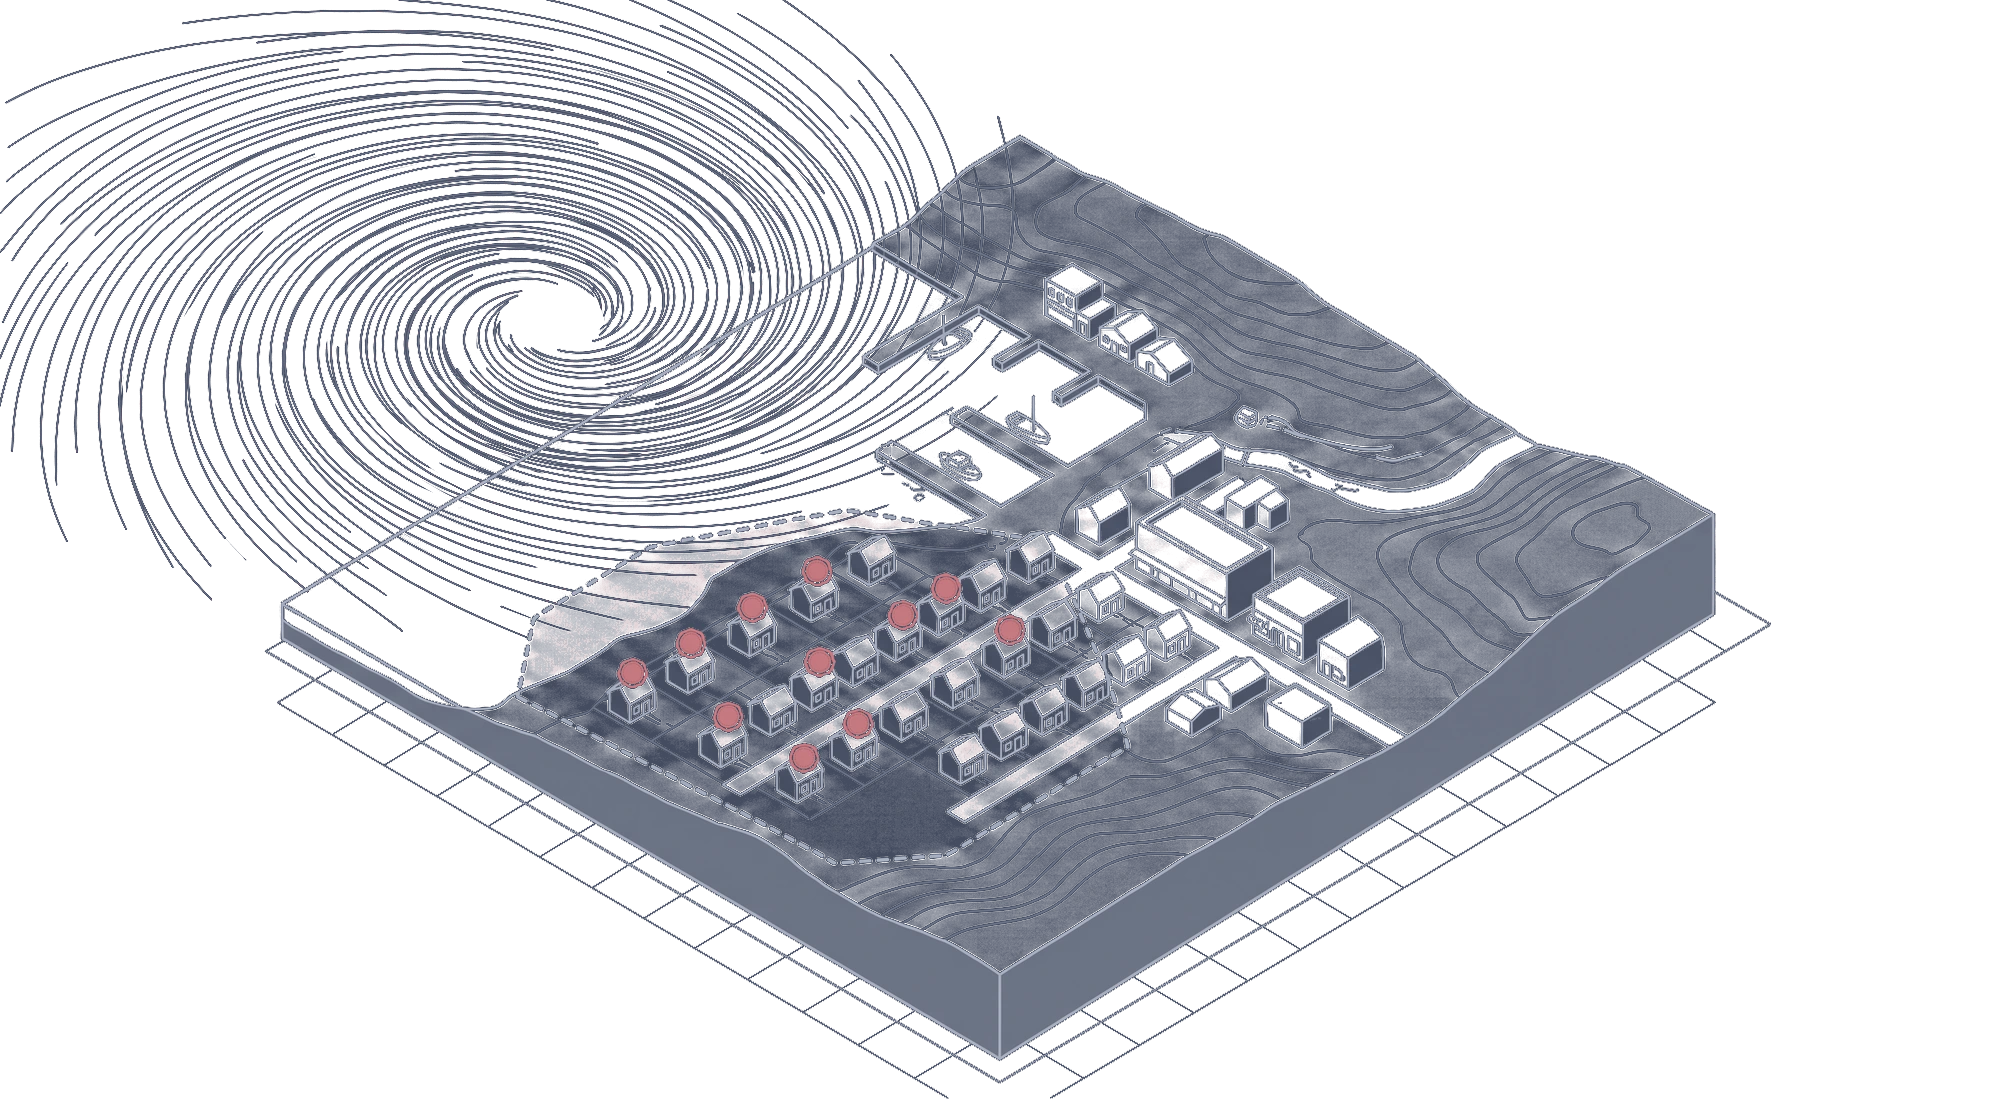
The feed arrives
Track, wind swath, flood extent or fire perimeter, from Copernicus, NOAA, USGS and FIRMS.
Draw or take the path
Use the forecast cone as it is, or draw the area you want to plan for.
See the exposure
Every insured location inside, with total insured value by line, band and reinsurance layer.
Open the claims
Claims are opened for the homes inside, loss adjusters are booked and customers are called first.
Exposure in the industry’s own format.
Exposure comes in and goes out on OED, the Open Exposure Data standard from the Oasis Loss Modelling Framework, so nothing is reshaped into a format of ours. Each location keeps how it was placed on the map, and your catastrophe model’s results sit beside it as a layer.
- Hazard feeds
Copernicus, NOAA, USGS and FIRMS, live, kept with the time each reading arrived.
- Exposure
OED location and account files, from your systems or your broker.
- Your models
Catastrophe model results shown beside the exposure, never replacing them.
- Policies and claims
Read from your policy and claims systems, as they are.
Works where the signal does not.
Loss adjusters take the map with them. Map packs are kept on the phone or laptop, capture works with no signal, and everything is sent when the device is back online.
- Map packs kept on the device
- Photos with their time and place
- Areas measured on the map
- Sent, in order, when the signal returns
- Photos
- 14, each with its time and place
- Where exactly
- 52.2713°N, 9.7026°W
- Damaged area
- About 38 m², drawn on the map
- Sent
- When the phone is back in signal
The Kerry map pack is kept on the device and was updated last night.
About maps and catastrophe.
Which hazard feeds does it use?
Copernicus, NOAA, USGS and FIRMS, live. You can add feeds of your own as extra layers.
Can we bring our own exposure data?
Yes. Exposure comes in on OED, the format the industry already uses, from your systems or a broker’s.
Does the map replace our catastrophe model?
No. It shows your model’s results beside the exposure and the claims. HONESTAS reads your systems and never replaces them.
Does it work with no signal?
Yes. Map packs are kept on the device, and capture in the field is sent when the device reconnects.
Who sees which layers?
Each role sees the layers it is allowed to. A layer you may not see says so, rather than staying silent.
Go deeper
Put your book on the map.
Bring your exposure as it is, and one storm from last season. We will show who was inside it and the claims that followed.