Back to gallery
a13-role-claims-lead · P1, P5, P7
Exposure map — claims lead
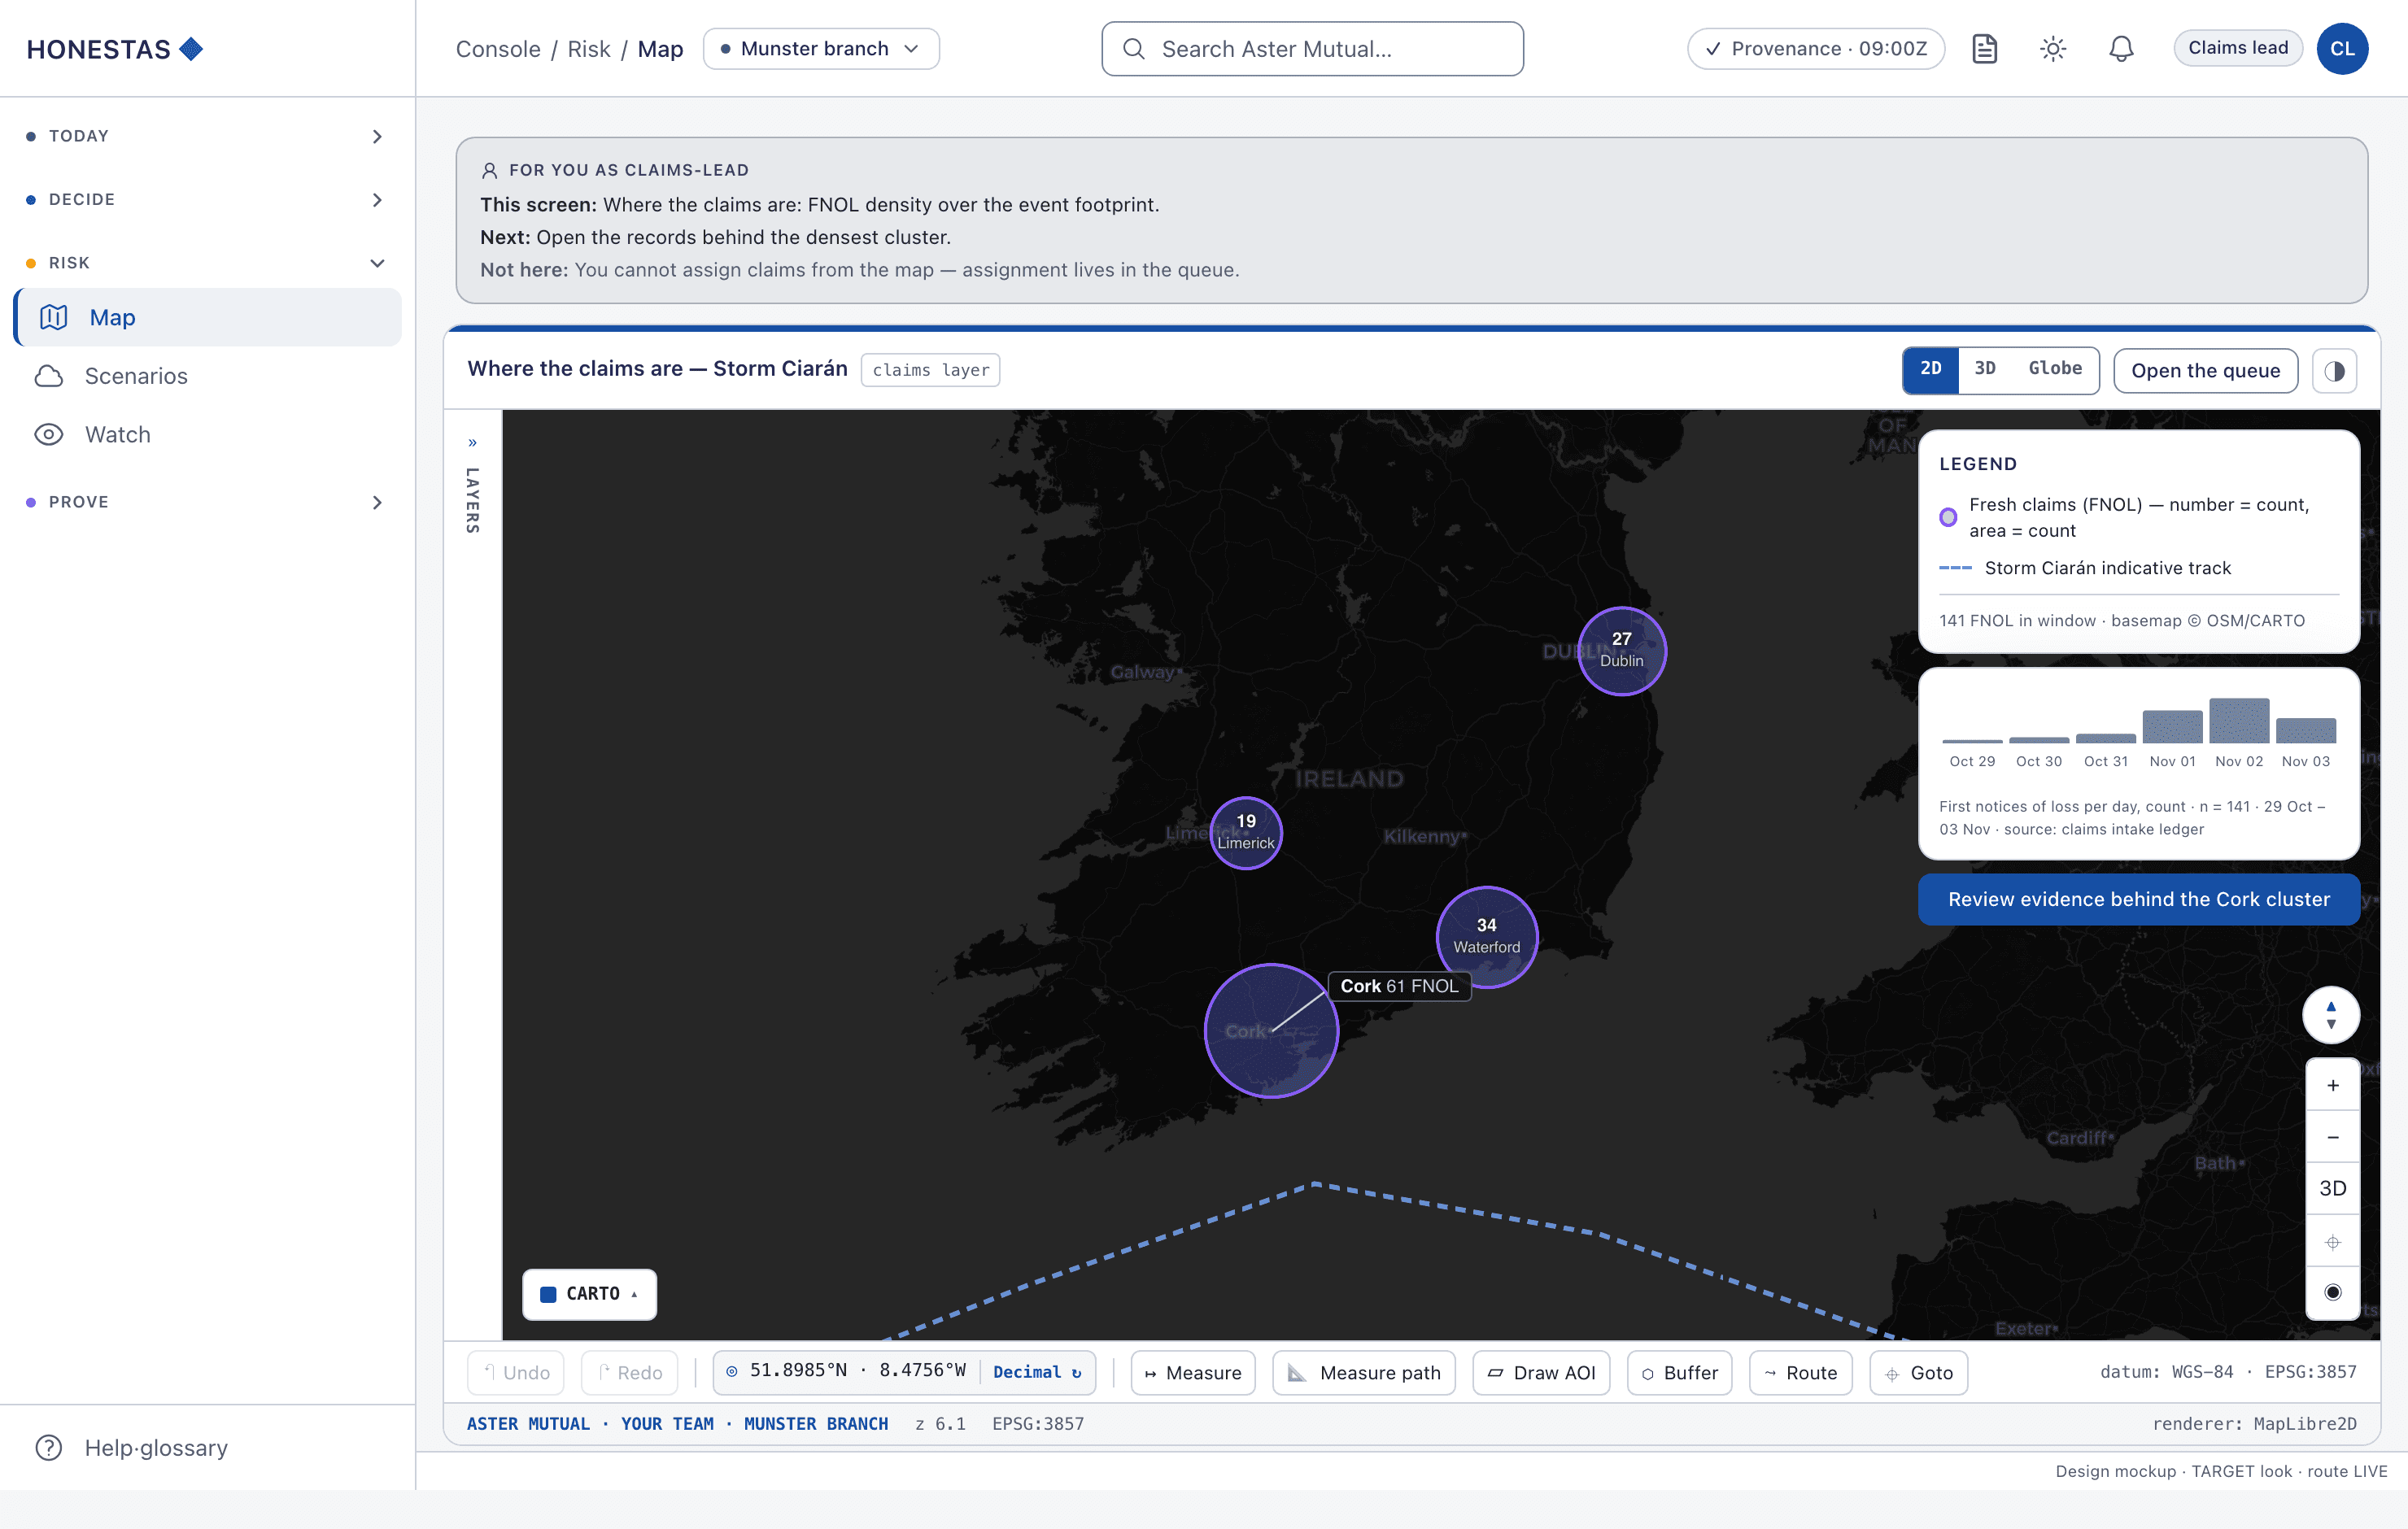
The exposure map as the claims lead sees it: an FNOL-density layer of graduated circles per county replaces the technical layer set, and the overlay figure becomes FNOL arrivals per day instead of a modelling figure.
What you would do here: Open the records behind the densest cluster.
- Role
- Claims lead
- Industry
- General insurance (P&C)Specialty & LondonLife & healthReinsuranceClaims cycle timeLoss ratioCompliance evidenceCAT readinessFraud
- Route
- /console/map
Design mockup, built from the real HONESTAS console components — TARGET look, not today's app.honestas.ai styling. Fixture data visible on the screen (organisation and person names) is illustrative — never a real customer. honestas-research/mockups/src/cases/a13-role-claims-lead.tsx